Geophysical data visualisation
Used GMT and shell scripting to combine gravity, seismic velocity and spatial data into a single crustal interpretation; awarded 95%.
Systems Geologist | Perth, Australia
A space for thoughts on industry trends and concepts I find interesting.
I am Harry O'Sullivan, a geologist based in Perth, Western Australia. I use technology to solve real operational problems.
I graduated from Durham University with a first-class degree in Geophysics with Geology. What I enjoyed most was using geoscientific data to build an interpretation: writing scripts, combining spatial datasets, testing models and deciding what the evidence supported. I moved to Perth in March 2023 to work as a FIFO Geologist with Fortescue.
Since starting in mining, my curiosity has expanded beyond geophysics. I continually pick up new skills in Python, GIS, SQL, Snowflake, machine learning, generative AI and product development and do so to solve real operational challenges.
I am still early in my career. I learn fastest by seeing real problems in-person: I start with a rough prototype, put it in front of users and engage directly with stakeholders to gauge what works, and what needs improvement.
Used GMT and shell scripting to combine gravity, seismic velocity and spatial data into a single crustal interpretation; awarded 95%.
Mapped seismicity, faults, GPS velocities, strain rate and seismic moment to explore how the plateau is deforming.
Used forward gravity modelling, bathymetry and magnetic data to investigate how an oceanic plate bends beneath a Hawaiian seamount.
Analysed CO₂ proxies and oxygen-isotope records to explore changing climate sensitivity through the past 67 million years.
Studied long-runout underwater sediment flows and translated the analysis into practical recommendations for subsea cable risk.
I am a keen and varied reader.
How the World Really Works
Red Plenty
Superforecasting
Children of Time
I want to improve how mining decisions are made—from how geological and operational evidence is collected and structured to how it informs project evaluation and capital allocation. Mining combines difficult physical constraints, fragmented data and deep specialist knowledge, making both good technology and sound technical judgement valuable.
My interest sits where geoscience, data, technology and investment decisions meet. I am interested in building tools that make operational decisions clearer, faster and more measurable, and in applying technical evidence to due diligence, asset evaluation and portfolio support. Long term, I would like to help build projects or companies around difficult mining problems.
Professional work shown here is simplified and anonymised. Descriptions reflect my own perspective and do not disclose confidential data or proprietary implementation details.
[ 2026-08-16 ]
An investor is buying exposure to the asset’s future value, the entity that owns that asset is using the sourced money to change that value, a drilling programme is one mechanism by which they can do that. A development-stage asset undertaking a resource definition drill programme is an example of that owner attempting to reduce uncertainty in a mineral resource and effectively better define the resource (Laplace: “Probability is relative, in part to this ignorance, in part to our knowledge”). A drill metre does not change the geology but instead what is known about the Geology. That information may create, destroy, or have no impact on the asset’s value, but the programme’s value may be in providing evidence that might weaken, invalidate or fail to support assumptions underlying the mine plan
Uncertainty-reducing data can come from a variety of programme types aiming to improve confidence in a specific variable, it is in the interest of the investor/owner to ensure that their capital is being used to target the specific confidence variable (ie. Density, Grade, Metallurgy, Geotech Conditions) that most impacts a downstream economic outcome (ie. Mine Life) and in turn impacts the next decision made. This process must consider whether a specific programme planned on the asset is likely to resolve that uncertainty, and if the potential results could influence that decision, this must be weighed against the cost of obtaining that data.
This process that an investor goes through to assess how its capital is being deployed through a drill programme involves technical assessment, this process involves asking three key questions, of course the purpose of these questions varies depending on whether the assessment is being conducted pre-investment (Technical Due Diligence), or post-investment (Portfolio Support).
My experience is in RC and Diamond drilling programmes in a Tier 1 mining company. Whilst Resource Definition should be considered as principally reducing uncertainty in grade, tonnage, geology and continuity, Geotechnical and Metallurgical programmes form an essential part of the wider definition programme from an investor’s perspective as they reduce uncertainty that can materially alter mine design, recovery, cost, mine life and hence project value. Below I map out some examples of how specific programmes map to potential consequences, downstream economic outcomes, and finally possible decisions based on the consequence and potential outcome.
| Programme | Example Result | Consequence | Downstream economic outcome | Possible decision |
|---|---|---|---|---|
| Grade & Continuity Grade Control (Operational-stage) |
Grade is different to model. Ore boundaries move |
Blocks in model reclassified Mining sequence assumption change |
Recovered metal changes – Plant feed changes – Near term revenue changes | Resequence mining |
| Density | Bulk density differs to value assigned to Geozone domain | Estimated tonnes change for interpreted volume | Resource tonnage changes – Unit costs change | Revise valuation |
| Geotechnical | Rock mass is more structurally complex than assumed | Pit slopes may need to flatten, additional support and monitoring required. | Changes recoverable inventory – Changes OPEX – Increases project risk | Redesign pit |
| Metallurgical | Hardness behaviour differs from assumptions | Comminution energy, throughput, equipment sizing and processing cost | Changes plant CAPEX and processing costs | Resize the plant |
Collecting data alone does not necessarily reduce decision-relevant uncertainty, the data collected must instead test an assumption, and change confidence in that assumption. A basic example would be that we are building a mine plan based on the assumption that the proposed slope geometry will remain acceptably stable under specified geological, structural and groundwater conditions. Data collected to update our confidence in this assumption would include structural mapping (spacing, surface roughness, orientation), measuring groundwater levels, pore pressure, and data required to test dewatering response.
Knowing if datasets will reduce uncertainty in an assumption is hard, this is where storing physical data assets is valuable as if more data is needed to test an assumption later, the asset can be referred to again, it effectively provides valuable optionality (though is restricted to only some potential datasets). It also extends further than just choosing what data to select, but also requires establishment of location, quantity, resolution and data quality.
This process here is effectively designing a test, in line with the scientific method this involves translating the underlying assumption into testable hypotheses (discretise assumption into a variety of variables), then whether a proposed sampling design is representative (Drilling a Geotechnical diamond hole that does not cover the relevant wall sector or depth would not be representative). The conditions that would cause a change in the underlying assumption must then be defined prior to testing. Finally, uncertainty in measurements and the model must also be accounted for.
Geoscientific data is multimodal and only valuable when it is interpreted effectively. There is a complex and often overlooked series of contributing factors to obtaining geoscientific data. The most obvious cost is acquisition, what sensor is needed, who collects that data. Validation and QAQC of datasets is a hugely important step, and can correlate with significant processing charges and time delays. Integration of data is concerned with using verified data within the context of other datasets by leveraging consistent locations, intervals, units of measurement and geological domains. Time must then be spent interpreting datasets and determining what the acquired information is actually saying, finally the data must be presented to decision makers in a sufficient manner, these steps require deep technical expertise.
There are also other hidden costs:
It is also essential to utilise as much pre-existing (but reliable and verified) data as possible, the workflow should continually seek decision-relevant uncertainty reduction relative to total cost, time and risk. It is also important to incorporate newly acquired data into the drill programme, effectively ensuring that the programme is capable of adapting at specified decision points. There is room to consider where drillholes can be used for multiple purposes, and a broad view of what downstream decisions need to be made can help align drillholes to optimise data usage.
There is a lot of work in the industry currently to convert historical data into standardised, quality-rated and decision-usable datasets, without obscuring uncertainty about its reliability (KoBold’s work with SMART Zambia and the Zambian Geological Survey). This presents a wealth of opportunity, my work has largely been focussed around streamlining data workflows and ensuring data undergoes effective QAQC. Where I see this going is using AI to streamline the process by mapping inconsistent legacy logging terminology onto standardised vocabularies and flagging anomalous values for geological review. Finally, if certain data bottlenecks such as lab processing time can be resolved (potentially using on-rig/near-rig sample analytical systems) and data latency reduced, we will be in a great place to make drill programmes more dynamic. Faster decision-ready data allows low-value holes to be identified, stopped, redirected and remaining metres allocated against the latest geological interpretation.
It is important to note that any material, uncertain assumptions made during due diligence should be expressed as hypotheses and should become testable after investment.
Pad and access readiness is one example of an assumption that can materially affect a drilling programme. Portfolio monitoring could test whether enabling works are progressing sufficiently to support the planned rig schedule.
From Portfolio Monitoring to Portfolio Support
Findings from this monitoring process must then materialise as actual portfolio support by quantifying the deviation, analysing its cause, and implementing a response. Of course, the extent to which an investor or portfolio-support team does this depends on its governance rights, but I would argue that assessing such assumptions is essential, and perhaps monitoring of key material assumptions warrants establishment in some cases during the transaction stage.
Penetration-rate assumptions provide another example. Initial forecasts will inevitably rely on incomplete information, but their accuracy should be tested and updated as programme-specific evidence becomes available.
“Do rig and core-diameter-specific estimates predict future penetration rates more accurately than the programme-wide average?”
A broad assumption may be sufficient to approve an initial budget. The logic must be Bayesian; portfolio monitoring should progressively combine prior evidence with new evidence relating to the rig, geology and operating conditions encountered.
Operational evidence must eventually feed back into the investment case. Changes in pad readiness and penetration rates affect programme cost, schedule and the timing at which decision-ready evidence becomes available. Monitoring should therefore update the programme forecast and economic case, allowing remaining capital to be continued, redirected or withheld.
An investor is not ultimately underwriting drill metres, but the information those metres are expected to produce and the decisions that information supports. Due diligence should identify the material assumptions within an investment case, whilst portfolio monitoring should test and update those assumptions as evidence becomes available. A drill programme creates value when it supports a better decision, whether that decision is to commit further capital, redesign the programme or avoid a larger loss.
[ 2026-07-26 ]
What happens when geological data becomes accessible enough to question?
Raw geological data is not particularly scarce.
Its quality varies enormously and it is often stored in frustrating places, but most large exploration and mining organisations already collect substantial quantities of information.
The range of quantitative data associated with a drilling programme can be enormous: assays, geological logs, downhole geophysics, surveys, drilling activity, machine telemetry, photographs and operational notes.
In some cases, new data is being generated every few seconds.
Despite this, only a fraction of that information is likely to be used regularly in day-to-day decision-making.
The problem is therefore not necessarily the availability of data.
It is the ability to find, combine and interpret the relevant evidence while a decision still matters.
The traditional approach to making operational data accessible is through reporting platforms such as Power BI and Tableau.
These tools are extremely useful for formal reporting, agreed metrics and questions that need to be answered repeatedly.
But reports are normally built around questions that have already been defined.
Someone wants monthly drilled metres, so a report is created.
Someone else wants the same number by contractor, project or drilling method, so additional views are added.
Other users want downtime, expenditure, hole-completion information or performance against plan, and the reporting environment gradually expands.
This creates two problems.
The first is maintenance.
Geological and operational datasets change frequently. Fields are renamed, classifications evolve, relationships change and new sources are introduced.
Reports need to evolve with them.
The second problem is more fundamental.
A dashboard can only answer questions that somebody anticipated when it was designed.
That works well for monitoring known metrics.
It works less well when someone notices something unusual and wants to investigate it immediately.
Natural-language data tools are beginning to make it easier to locate datasets, generate queries and retrieve information.
That is useful.
But finding a field is not the same as understanding what it represents.
A system might locate a column containing iron assay values and correctly identify what those values measure.
It does not automatically understand why a particular assay result matters to the design of a drilling programme.
For a metallurgical diamond hole, a change in grade might affect decisions about sample representativity, geological boundaries, variability or the quantity of material required for testwork.
In an RC programme, the same geological variable might instead influence infill priorities, target boundaries or decisions about additional drilling.
The number is the same.
Its significance depends on the geological setting, the objective of the programme and the decision being made.
A technically correct query can therefore still produce a geologically meaningless answer.
This is why I think the more interesting problem is not simply data access.
It is interpretation.
Imagine that a geologist could ask questions directly of a collection of governed geological and operational datasets.
Instead of first identifying the correct report, application or database table, the user begins with the geological or operational question.
For example:
Which holes were completed this week?
Where are drilling conditions repeatedly deteriorating?
What were the main causes of downtime during a particular programme?
Did a change in drilling performance coincide with a geological boundary?
Do observations recorded by field crews correspond with patterns visible elsewhere in the available data?
Some questions require little more than a simple aggregation.
Others require spatial analysis, chronology, text interpretation or the combination of several different forms of evidence.
That distinction matters.
The interesting opportunity is not simply replacing SQL with natural language.
It is making it practical to investigate relationships that would otherwise take too long to explore.
Once access becomes easier, users may stop asking only for predefined KPIs.
They can begin asking about chronology, relationships, causes and uncertainty.
Natural language can make data easier to access, but it does not remove the underlying complexity.
If anything, it makes data governance more important.
A useful system needs to understand how datasets relate to one another, which fields should be used and what common terminology actually means.
Consider something as simple as drilled metres.
Depending on the organisation and the question being asked, this could refer to planned metres, reported metres, validated metres or a figure derived from another operational system.
Those distinctions may be obvious to an experienced employee.
They are not necessarily obvious from the database schema.
The same problem appears throughout geological data.
A blank value might mean that information has not yet been entered, that an activity did not occur or that a particular field is not relevant.
A hole may have several identifiers across different systems.
A status field may describe the current state of a hole without preserving the history of how that state changed.
An operational note may contain useful evidence but be incomplete or highly subjective.
A trustworthy conversational system therefore needs to recognise ambiguity rather than simply producing an answer.
Access without interpretation is simply a faster route to the wrong answer.
This also creates an interesting secondary benefit.
Every question that cannot be answered exposes something about the organisation's data.
It may reveal a missing dataset, an unclear definition, a broken relationship between systems or important knowledge that currently exists only in the head of an experienced employee.
Conversational access can therefore become a form of audit.
It reveals not just what information an organisation possesses, but how well that information is actually understood.
Field geologists collect large amounts of information but often have limited time to investigate the wider context around an observation.
A geologist may notice an unexpected change in penetration rate, an unusual contact, a deviation in hole trajectory or a recurring drilling problem.
Investigating that observation properly might require retrieving nearby logs, surveys, assays, photographs, drilling records and previous field notes.
Those records may exist.
The difficulty is finding and reconciling them quickly enough to influence the immediate interpretation.
Accessible and well-interpreted data could shorten the distance between an observation and a testable question.
A geologist might ask whether the same drilling signature appeared in nearby holes.
They might investigate whether it corresponds with a mapped or logged geological boundary.
They might compare similar intervals with assay results or search previous field observations for the same behaviour.
This does not replace geological judgement.
A data system did not stand at the rig.
It did not inspect the chips or core, speak to the driller or experience the combination of small observations that made something feel unusual.
What it can do is make more of the surrounding evidence available while that judgement is being applied.
field observation → question → supporting evidence → revised interpretation
If less time is spent locating information and reconciling systems, more time can be spent testing hypotheses.
The role of the geologist may therefore move further towards interpretation rather than information retrieval.
Their ability to ask a meaningful question becomes more important, not less.
There is also a broader question about what should count as geological data.
Machine and operational datasets are normally collected for operational purposes.
But some of those signals may indirectly contain information about the geology being encountered.
Changes in penetration rate, drilling behaviour, vibration, energy use or other operating characteristics may correspond with changes in ground conditions.
That does not mean that an operational signal should automatically be interpreted geologically.
There are many competing explanations.
Equipment condition, operator behaviour, drilling parameters and maintenance issues can all create similar patterns.
But the availability of these datasets creates the opportunity to test whether relationships exist.
Machine telemetry may therefore become another source of evidence that can be compared with geological observations rather than viewed solely as an operational dataset.
The next step is systems that do not always wait for somebody to ask a question.
Incoming data could potentially be compared with historical behaviour to identify unusual conditions.
Changes in drilling performance could be compared with previous holes.
New assay results could be checked against geological expectations.
Repeated operational behaviour could be assessed against earlier events.
The useful output would not simply be an alert.
It would explain what changed, where it occurred and which evidence makes the observation interesting.
There is an obvious danger.
Poorly designed systems could generate enormous numbers of weak correlations, unnecessary notifications or apparently confident conclusions based on incomplete information.
More data does not automatically create better decisions.
The objective should therefore not be to tell users everything that can be found.
It should be to identify the relatively small number of observations that deserve human attention.
It is tempting to think of conversational data access primarily as a more convenient reporting interface.
I suspect its more important effect may be the questions it allows people to ask.
What relationships have never been investigated because the relevant evidence sits in separate systems?
Could operational data contain useful geological signals?
How much field knowledge could be retained if observations were easier to connect with later evidence?
Can uncertainty be presented alongside an answer rather than hidden behind it?
Will easier access improve geological decisions, or simply increase confidence in imperfect information?
Static reports will remain useful.
There will always be recurring metrics that need clear definitions, stable calculations and consistent presentation.
But exploratory geological work is different.
It involves following observations, testing explanations and combining incomplete pieces of evidence.
The interesting question is therefore not whether AI can query geological databases.
It is what geologists might notice when the evidence surrounding their work becomes accessible enough to question.
[ 2026-05-11 ]
Oliver is a small browser-based project management application for turning messy delivery work into a visible map. I built it with Claude, using the project as a way to explore how planning software can show both formal structure and practical dependencies at the same time. My experience and preferred style of working shaped a simple but powerful concept.
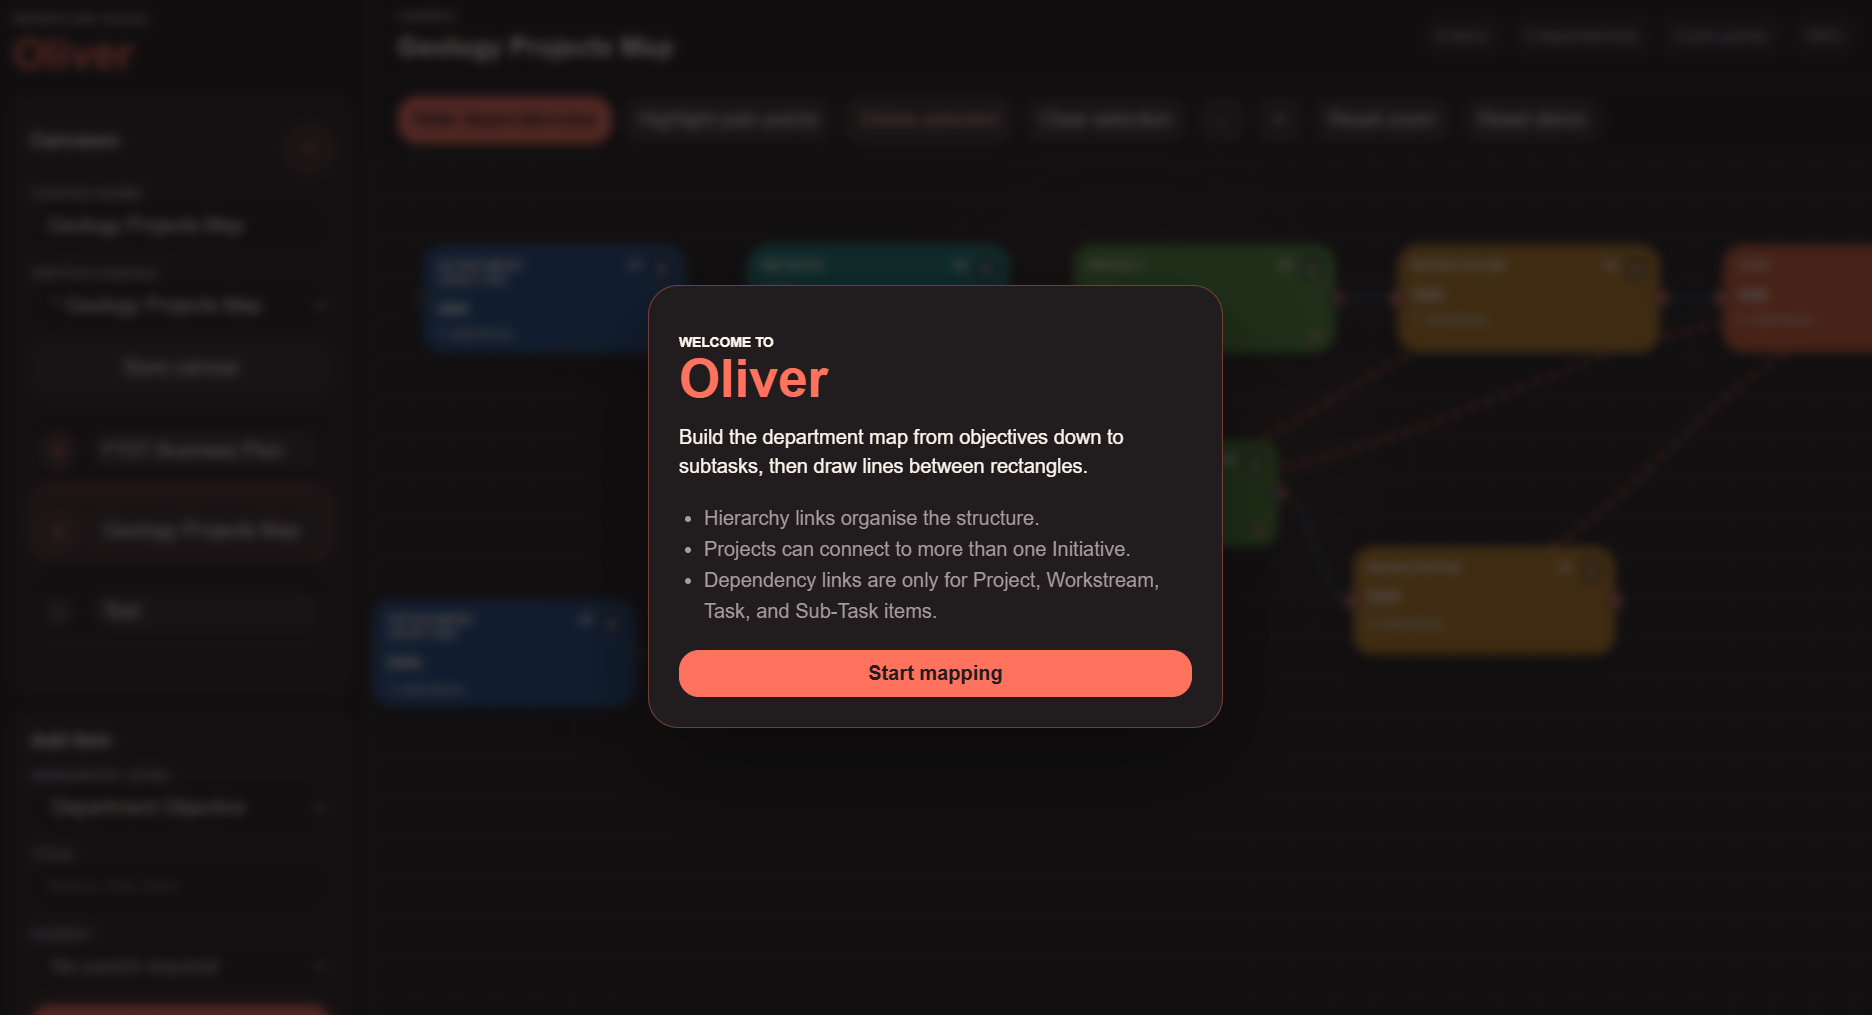
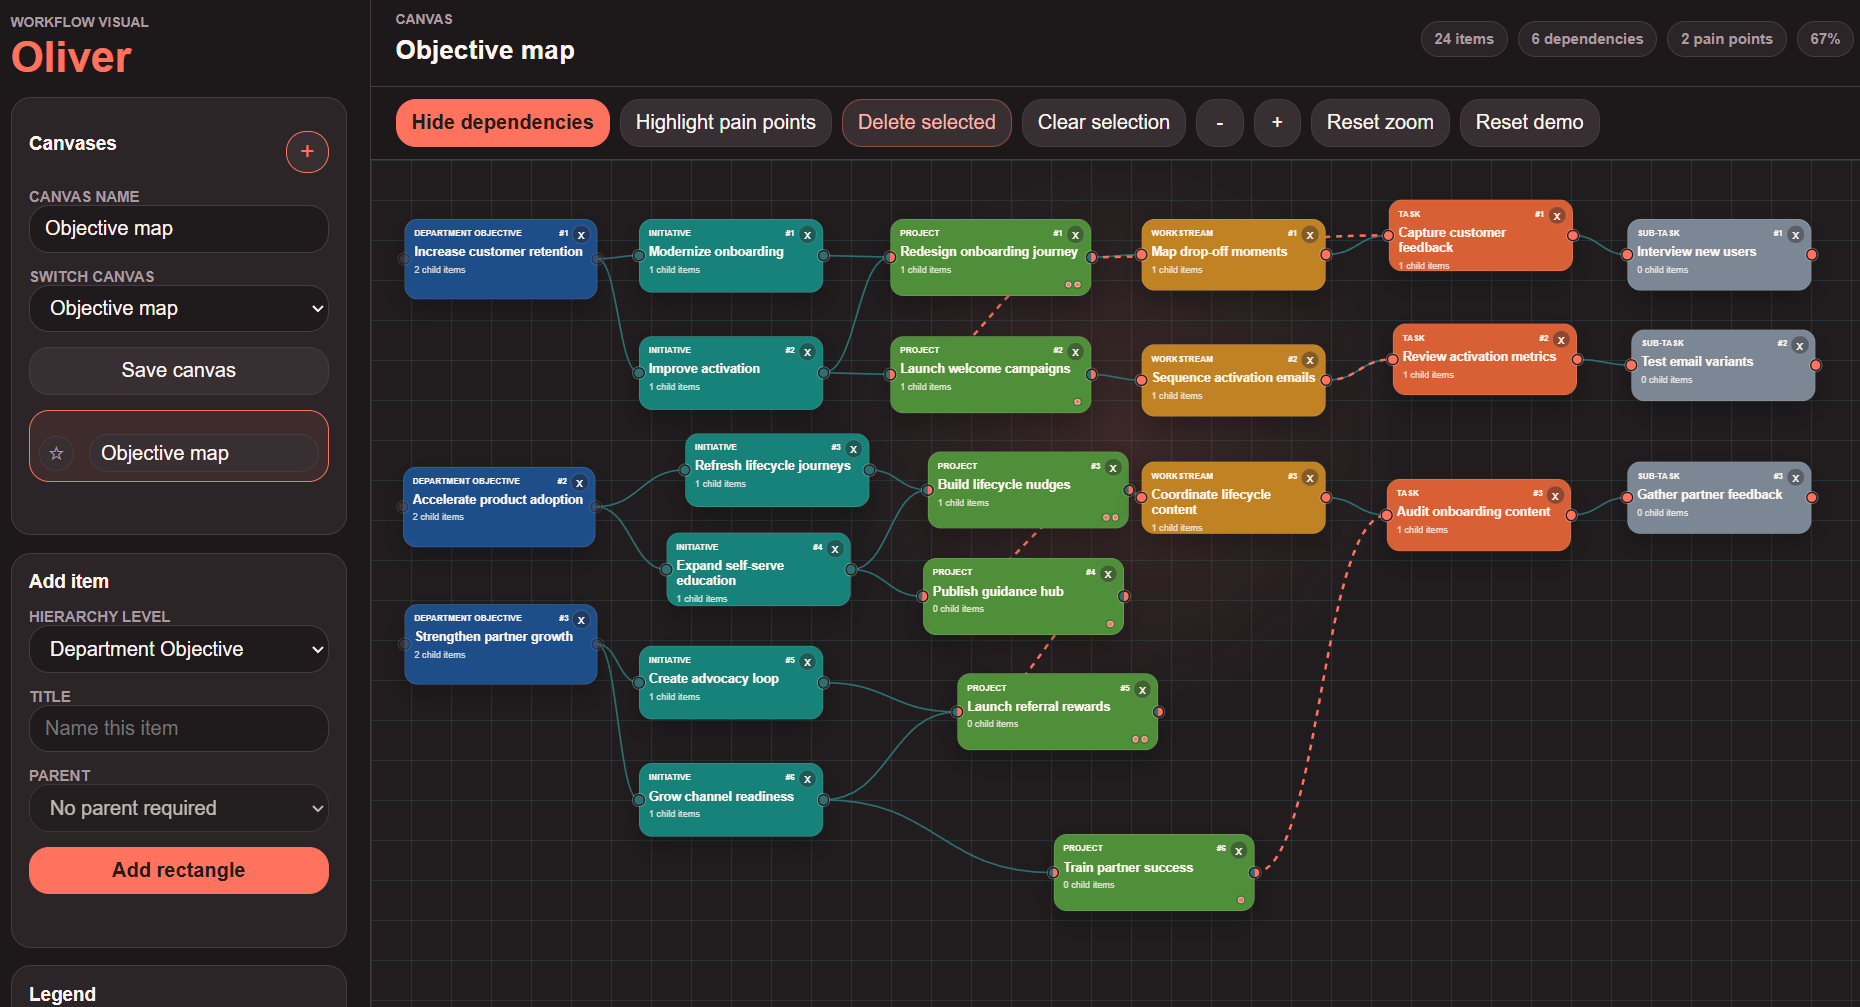
The concept is a canvas where every piece of work is represented as a rectangle. A specific objective can be broken down into initiatives, projects, workstreams, tasks and subtasks, creating a clear hierarchy from strategy through to execution. Instead of hiding that structure inside nested lists, Oliver lays it out spatially so the shape of the work can be read at a glance.
The application also separates hierarchy from dependency. A project can belong to an initiative, but it can also depend on a workstream, task or subtask somewhere else in the map. Those dependency links are drawn directly between rectangles, making it easier to see where delivery risk, handoffs or coordination problems might sit.
Users create canvases, add work items, choose each item's level in the hierarchy, and place it on the map. Items can be dragged around freely, while their connecting lines follow them. The tool uses colour to distinguish levels of work, green connectors for hierarchy relationships, and coral connectors for dependencies.
When a user starts drawing a connection, Oliver highlights valid targets and fades out unavailable ones. This keeps the map flexible without letting the structure become meaningless: objectives flow down through the hierarchy, while dependency links are reserved for the levels where actual delivery coordination usually happens.
This project was entirely 'vibe' coded, and I used a typical approach: start with the feeling of the tool, make the smallest working version, then tighten the rules as the product logic became clearer. The first idea was simple: combine visual freedom with the accountability of establish planning tools. From there, the work became less about adding features and more about deciding what the map should refuse to do.
The hierarchy was the anchor. I settled on Objective -> Initiative -> Project -> Workstream -> Task -> Sub-Task, then used that as the source of truth for creation rules, valid hierarchy links, and visual colour. Every item stayed as the same rounded rectangle so the interface did not become visually noisy; the object type, connector state and relationship rules carried the complexity instead.
The interaction model changed through iteration. The early version used dropdowns to create relationships, which worked technically but felt too administrative for a canvas tool. The next version moved relationship creation onto the map itself: connector dots on each rectangle, drag-to-link behaviour, target highlighting while drawing, and a small pop-up that asks the user to choose between hierarchy and dependency only when that choice is valid.
That rule-checking became the main technical pattern. Hierarchy links are validated against the object stack, with one important exception: a Project can be tied to more than one Initiative. Dependency links are deliberately narrower and cannot go higher than Project, so Initiative and Objective objects remain strategic structure rather than operational blockers. When a rectangle is moved, its stored coordinates change and the SVG relationship paths are recalculated from those coordinates, which keeps the diagram feeling alive without needing a heavier canvas engine.
The development process was conversational and visual. Each pass started with a product instinct: make it blank on startup, remove bulky explanation, make the background darker, make rectangles rounder, allow free zoom, add saved canvases, then make the lines feel hand-drawn rather than form-driven. The result is a small prototype, but the logic underneath is already close to a real product model: typed objects, relationship validation, local persistence, canvas navigation, and visual feedback during user actions.
Most project management tools are good at storing tasks, but less good at showing why one piece of work is blocked by another. Oliver treats the project plan as a living diagram. It is meant to help a team see where work belongs, how it connects, and which items are becoming pressure points because too many dependencies run through them. If a team wants to delegate work out, Oliver can provide a platform for visibility on downstream reasoning behind a project.
The pain-point view is designed for moments where a user or manager needs to know what to push next. If a blocker is visible as a shared pain point, it becomes much easier to see that resolving one issue could get several projects moving again.
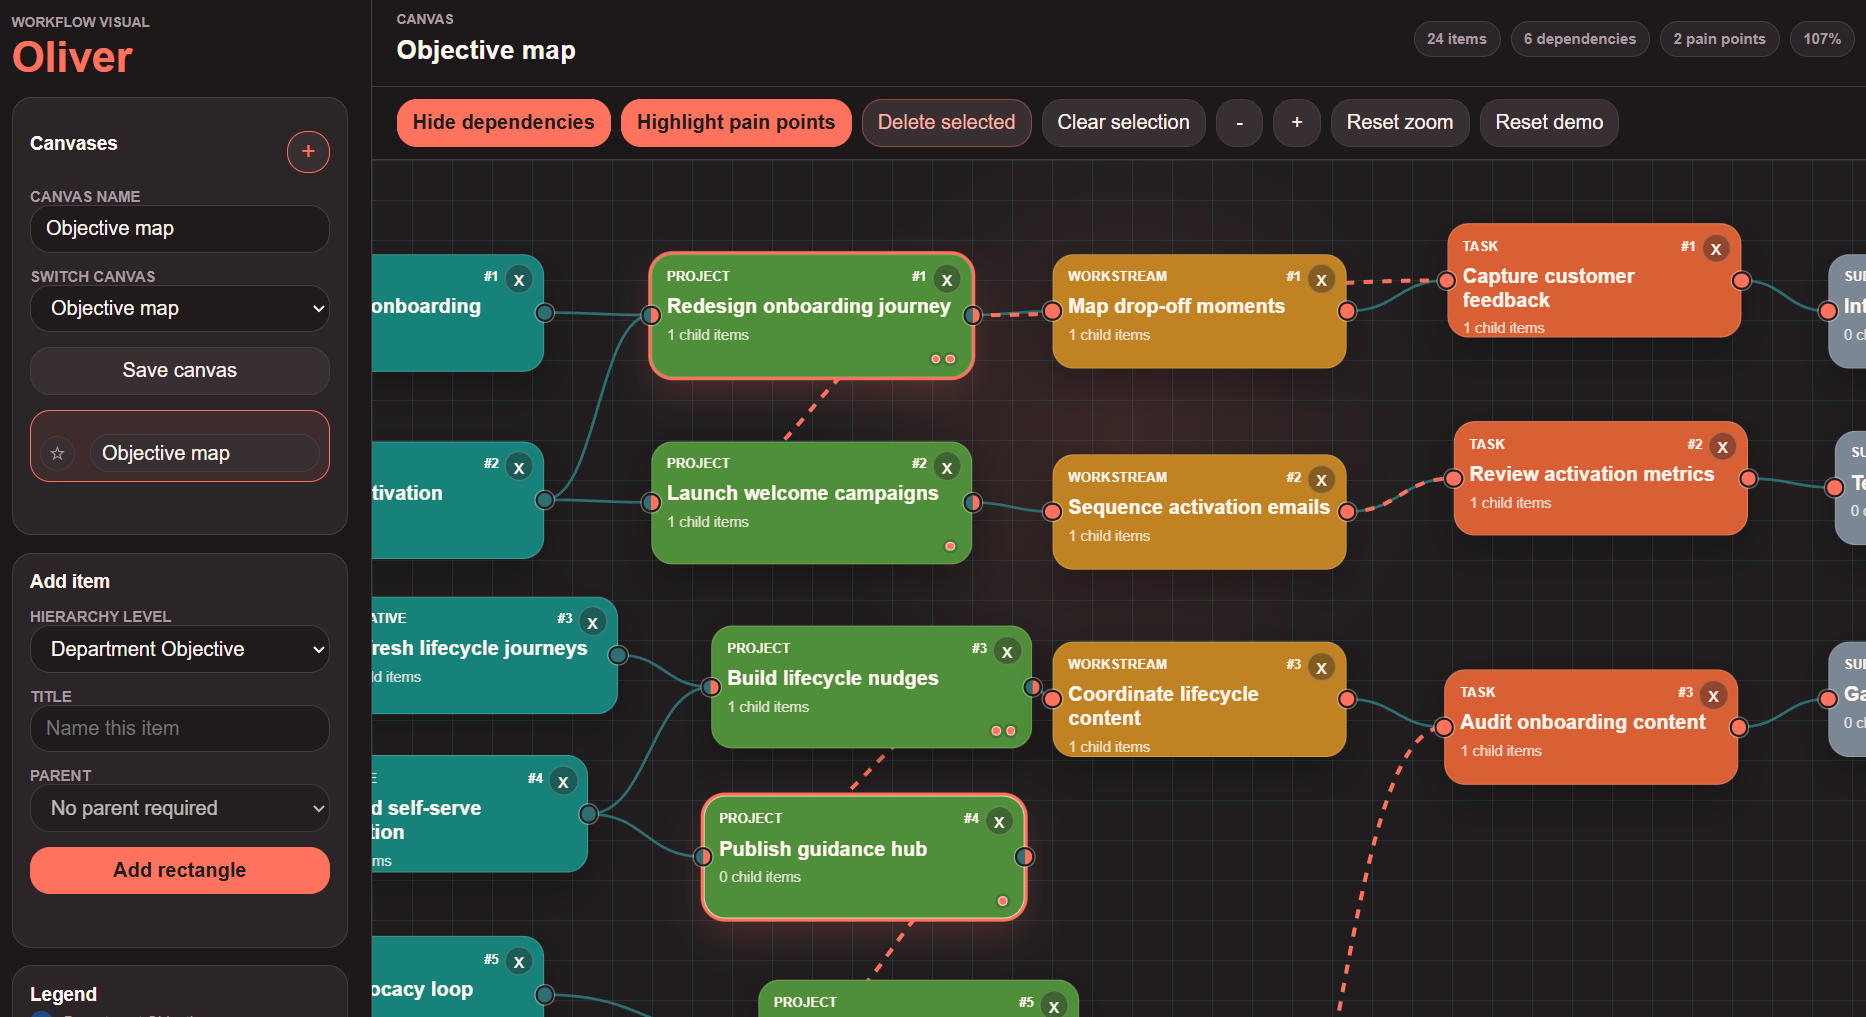
The Oliver demo includes local canvas saving, quick switching between saved maps, starred canvases for important flows, zooming, panning, dependency visibility controls, and a pain-point view that highlights items with multiple dependency connections. The result is less like a task list and more like a working model of how delivery is actually arranged.